")
By Rajiv Partap Singh
Google Analytics is the most popular free analytics tool in the market. However, most of the webmasters use analytics only to see basic reports and graphs. They don’t dig in depth and find the very powerful features of analytics that can take your business to the next level.
There are really some of the most useful and advanced features that the site owners should definitely know.
Here I’m going to show you the 5 awesome techniques you can do with Google Analytics to get most of its reports and to improve your website’s content, conversion, and user experience.
Launch Event as a Goal
You can use the events for recording the user interaction with the website elements. You can find this method in ga.js tracking code. This can be done by attaching the method call to the UI element which you want to track. It actually works on an object-oriented method that is used to collect the interactions.
With this method, tracking can be applied on occurrence of following events:
- Page Gadgets
- Flash-driven element
- Embedded AJAX page elements
- File download
This feature of Google Analytics is useful to test that whether your customers are clicking on your website or not.
The best thing is that it’s quite simple to do.
Here is the basic format of event tracking code:
_trackEvent(category, action, opt_label, opt_value, opt_noninteraction)
The terms in brackets can be defined as:
1. Category – It defines the type of event. Although this label is mandatory but you can call it anything as per your wish.
2. Action – In this label, you have to explain the action which describes the event.
3. Opt_label – This is an optional label to describe the event.
4. Opt_value – This is also an optional field which includes the worth of action. Don’t include the currency symbol.
5. Opt_noninteraction – After finishing the event, if you want it to affect the bounce rate of the page, then enter “False” else enter “True”.
Let’s assume I had a pdf of this article available for download. My “download” tracking code will look like this:
_trackEvent(‘blog’, ‘download’, ‘advanced google analytics’, 10, True)
But this code is useless until you add “onClick” property to it.
The proper download link to pdf will look like:
Download the Advanced Google Analytics Tricks PDF
You can also set these events as goal conversions and assign monetary value to it.
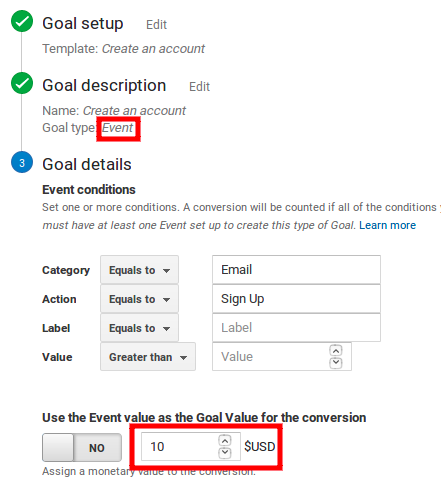
It includes the benefit of both event tracking and goals.
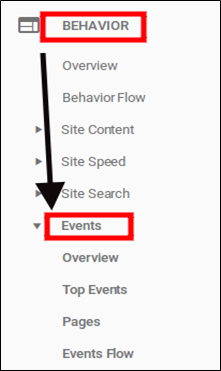
To view its reports, you can see it in Behaviour -> Events
That’s it! Easy, right?
Segmenting is the Real Power
Most of the webmasters end up in analyzing the overall traffic which are next to useless. You need to dig deeper if you want your work to create good results by advance level of digital marketing strategies .
Segments are the gold mine!
These are basically the small pieces of a whole. With respect to GA, a segment lets you look at your traffic and user stats through a particular lens.
These are the small fragments of the whole report. It allows you to see the traffic and user stats with a particular criteria.
You can use segments as:
■ traffic source
■ device
■ browser
■ page
■ landing page
■ returning vs new visitors…
…and much more.
On the dashboard, you will have the option of adding a segment.
You will see reports like this:
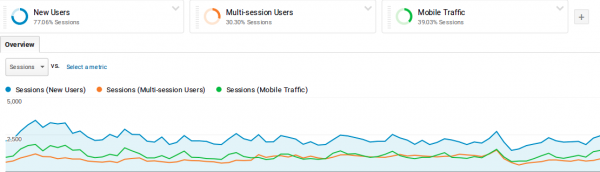
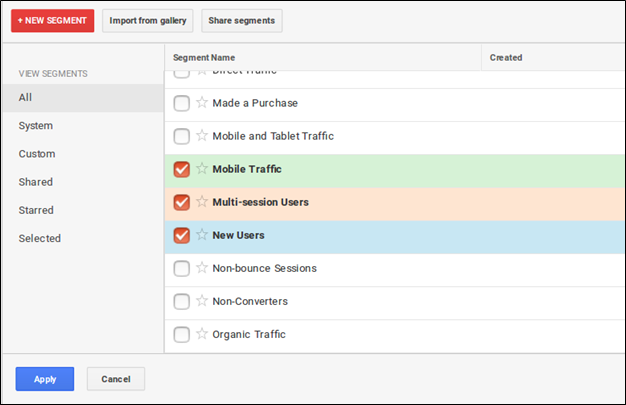
You can also create advanced segments as well as multiple segments to compare in between them.
For creating advanced segments, “Admin > View > Segments”. Click on big “New Segment” option.
You will see a table like this:

You can choose any combination of options.
The best thing is that you can easily add and remove segments and add multiple segments in the same report.
Happy Segments!
Use Metrics to Create Custom Dashboard
Segments don’t save reports i.e. you have to add segment every time you load Google Analytics.
You can create your own report by combining the important stats and metrics from all other reports that too in one screen. It is called as dashboard .
To create a new dashboard, click Customization -> Dashboards. Click on red button labelled with “create.”

After that you will see a new window like this:

In Blank Canvas, you will have to start from scratch while in the starter, you will have some of the common widgets to start.
If you choose a blank canvas, you will see a new window with various features to add in your dashboard like this:

Choose the features which you want to add in your dashboard.
In starter dashboard, you will see a dashboard with default features like this:

That’s it!
Discover the Location of Visitors
It is quite difficult to find out that who you should target during your campaigns. You might want to focus on a specific country or wanna go worldwide. It’s totally according to your requirements.
But wait. Let’s thanks Google Analytics for this.
You don’t have to worry more because it has a nice feature to see the visitor’s location demographics.

You can clearly see here your worldwide stats along with the session duration and bounce rate of the visitors from different countries. You can even examine deeply to the regions of a particular country and these stats.

Now you know the specific part of the country where you have more conversions. You can focus on them to get more goal completion for your site.
Last, the Worst Performing Pages
Analytics is good in finding out the pages which are not doing good. Some of the top pages can be your top exit pages. These pages tell you that how many people are arriving and exiting from each of the individual website pages.

In websites, other than blog, people don’t find what they are looking for and then leave your website. Therefore, you need to evaluate the reason because of which they are leaving. You need to test the content of your site to confirm that visitors are finding what they are looking for and getting a call to action to your website, like subscribing or purchasing a product.
Google Analytics let you track the work you do for your site. So it’s important to test the changes and backup those with the data.
These 5 advanced Google Analytics tricks will let you gain more into the user experience of your site, more than the basic reports. Along with these techniques, find more as GA has tons of features and use them to get better insights on your business.
Rajiv Partap Singh from WebSpero Solutions. I’m a professional Digital Marketing Expert . However, blog writing is my passion and have been writing for the last 6 years on various niche and industries. Apart from blog writing, I am Google Adwords Certified Member. In my free time, I love to meet new people at new places.


